

A five-mile taxi ride for $1.50. Ten miles for $3. If robotaxis could reliably deliver those fares, a short ride could become an easy everyday purchase and a second car a harder expense to justify. Two adults sharing would pay 75 cents or $1.50 each. The household saving could be substantial. A city making the same choice would also have to count the vehicles moving through its streets.
At Tesla’s 10 October 2024 We, Robot unveiling, Elon Musk separated operating cost from customer price. Quartr’s published transcript gives his price projection as: “price, including taxes and everything else, probably ends up being $0.30 or $0.40 a mile”. Operating cost was a separate, roughly 20-cent projection. Here, assume the optimistic customer fare eventually works sustainably: US$0.30 per occupied vehicle-mile, with normal costs and taxes covered, without booking fees, minimum charges or peak surcharges. This is a future scenario, not a current tariff. [1]
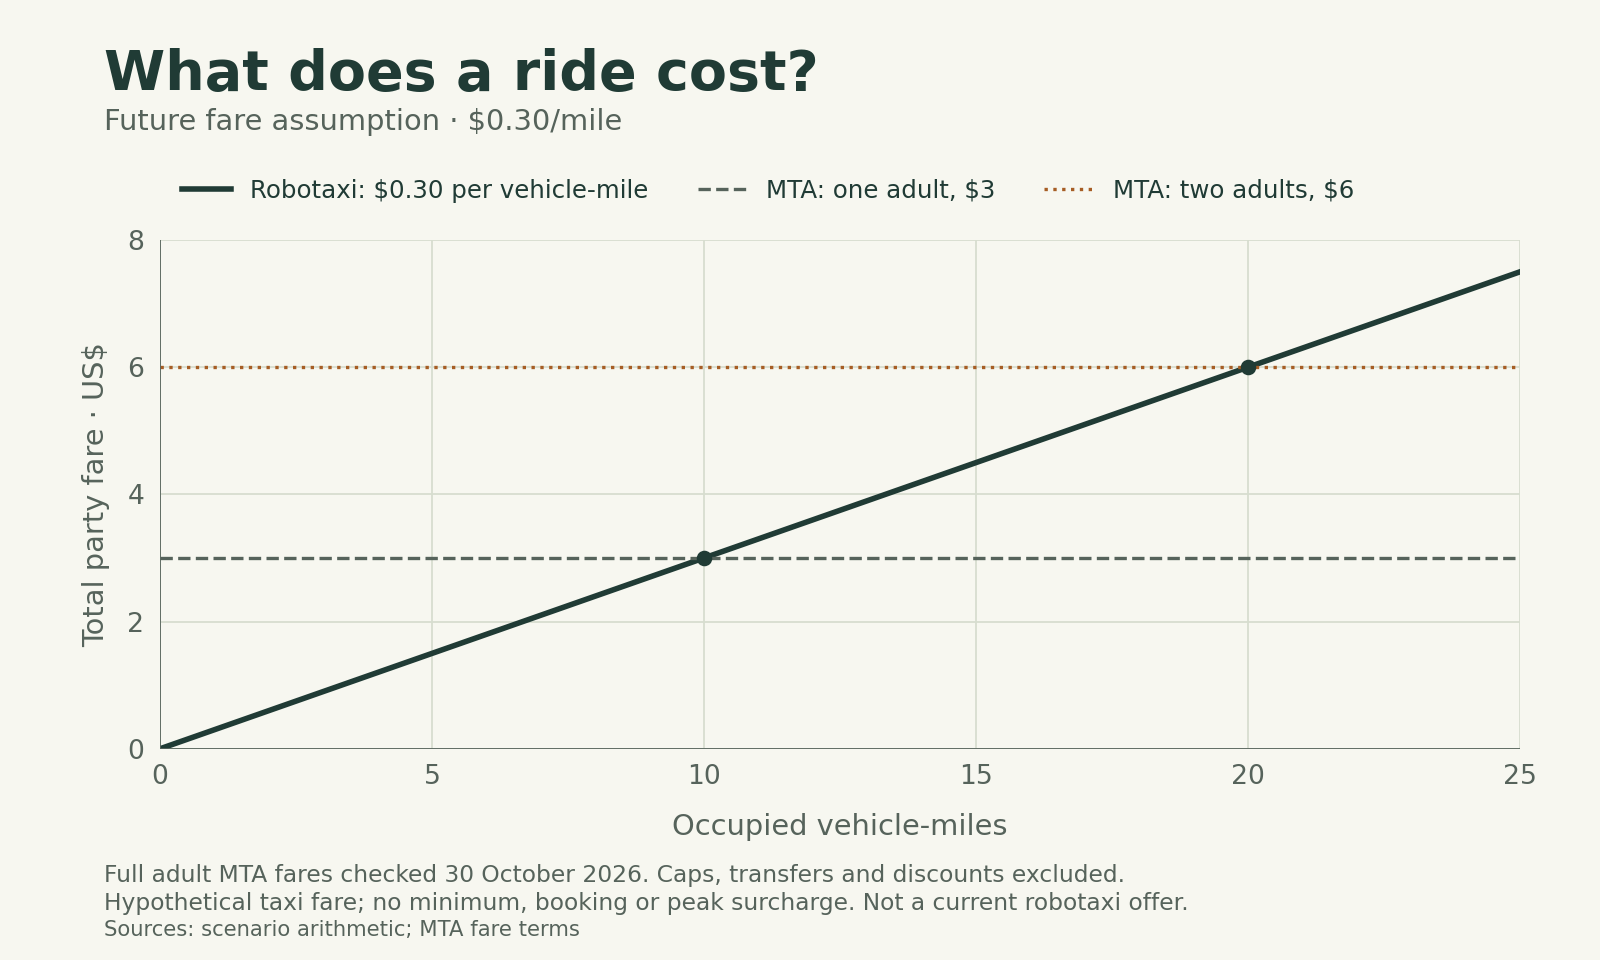
That price could undercut a bus ticket for some journeys. New York’s MTA currently charges most adults $3 for a subway or local-bus journey. At the assumed taxi fare, one adult reaches that price at ten miles; two full-fare adults sharing reach their combined $6 at twenty miles. But transfers, discounts and fare caps change the comparison. Once a traveller reaches a cap, another eligible transit journey can cost nothing extra. [2]
A transparent future-price scenario
What 30 cents a mile would buy
Illustrative US$0.30 fare; reference fares checked 30 October 2026
| Journey distance | Fare per vehicle | Per person, two sharing |
|---|---|---|
| 5 miles | $1.50 | $0.75 |
| 10 miles | $3.00 | $1.50 |
| 25 miles | $7.50 | $3.75 |
| 100 miles | $30.00 | $15.00 |
| 200 miles | $60.00 | $30.00 |
Open the standalone chart (PNG)
The MTA comparison is one eligible full-fare journey before caps, transfers, concessions and free child fares. It does not describe an available robotaxi tariff.
US cents are not British pence. Future local fares, reliability and journey availability still need their own comparison.
Quartr transcript via Stock Analysis: We, Robot 2024: published Quartr transcript · Metropolitan Transportation Authority: Subway and bus fares
Thirty US cents is also not 30 pence. London’s £1.75 Hopper bus fare, valid through 31 October 2026, allows further bus or tram journeys within an hour; its announced replacement is £1.85 from 1 November. A British robotaxi service would need its own comparison in pounds, with local taxes and fare rules. Subsidised tickets and an operator’s underlying costs are different things. [3]
The first household calculation could be the second car. A vehicle used mainly for occasional errands or an overlapping school run still brings insurance, depreciation and other fixed costs. If dependable rides cover those gaps, a family could keep one versatile car and buy the remaining journeys. Lower-income non-drivers could also gain useful access to jobs and services. Availability, accessible vehicles and the ability to travel at the required time would matter as much as the headline fare.
AAA’s 2026 US study estimates $12,863 a year to own and operate a new vehicle, using five years and 75,000 miles. That includes depreciation and finance alongside running expenses. It is useful context, not the saving every existing owner could make. Someone choosing between driving a car they already keep and booking a taxi faces a different calculation from someone deciding whether to buy or retain that car. [4]
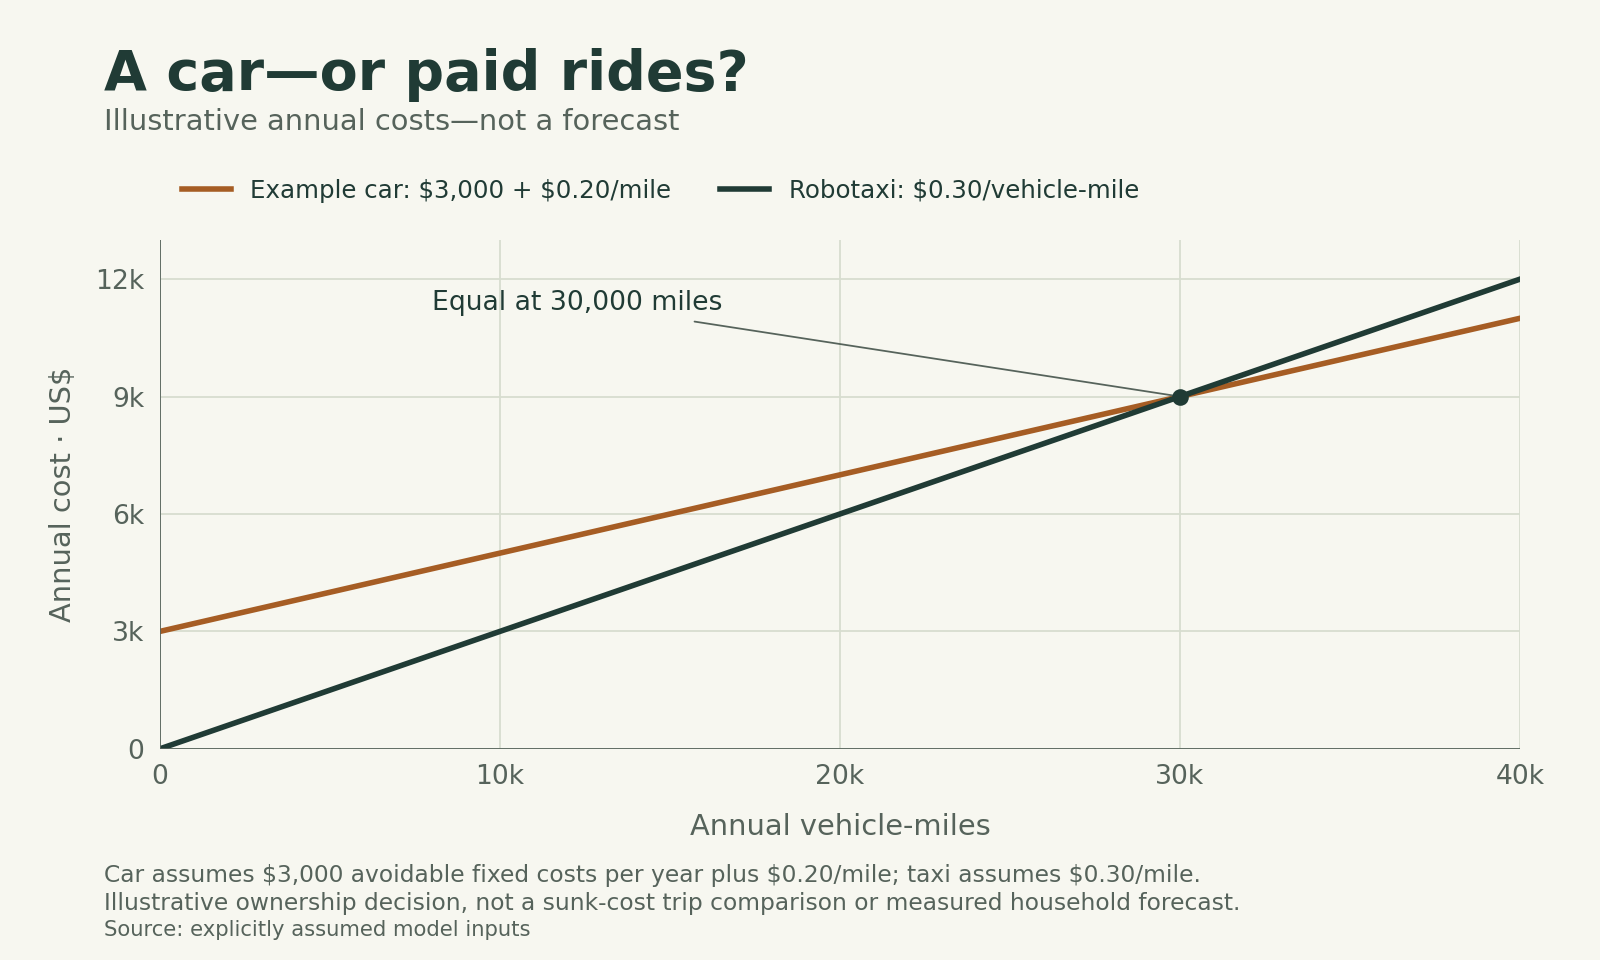
Consider an illustrative car with $3,000 in avoidable annual fixed costs and 20 cents a mile in variable costs. At 10,000 miles a year, its total is $5,000; the assumed robotaxi fare is $3,000. At 30,000 miles, both reach $9,000. Above that point the example car becomes cheaper. These are illustrative inputs to show the decision, not measured household costs. The expenses that actually disappear when a car is sold or not bought determine the real saving.
A transparent future-price scenario
When would a second car cost more?
Illustrative US$0.30 fare; reference fares checked 30 October 2026
| Annual vehicle miles | Illustrative car cost | Robotaxi fares |
|---|---|---|
| 5,000 | $4,000 | $1,500 |
| 10,000 | $5,000 | $3,000 |
| 20,000 | $7,000 | $6,000 |
| 30,000 | $9,000 | $9,000 |
| 40,000 | $11,000 | $12,000 |
Open the standalone chart (PNG)
These are illustrative inputs, not AAA or Tesla estimates and not a guarantee of household savings.
The model concerns avoidable ownership costs, not only fuel or the cost of another trip in a car already kept.
AAA–The Auto Club Group: New vehicle ownership costs hit $12,863 annually
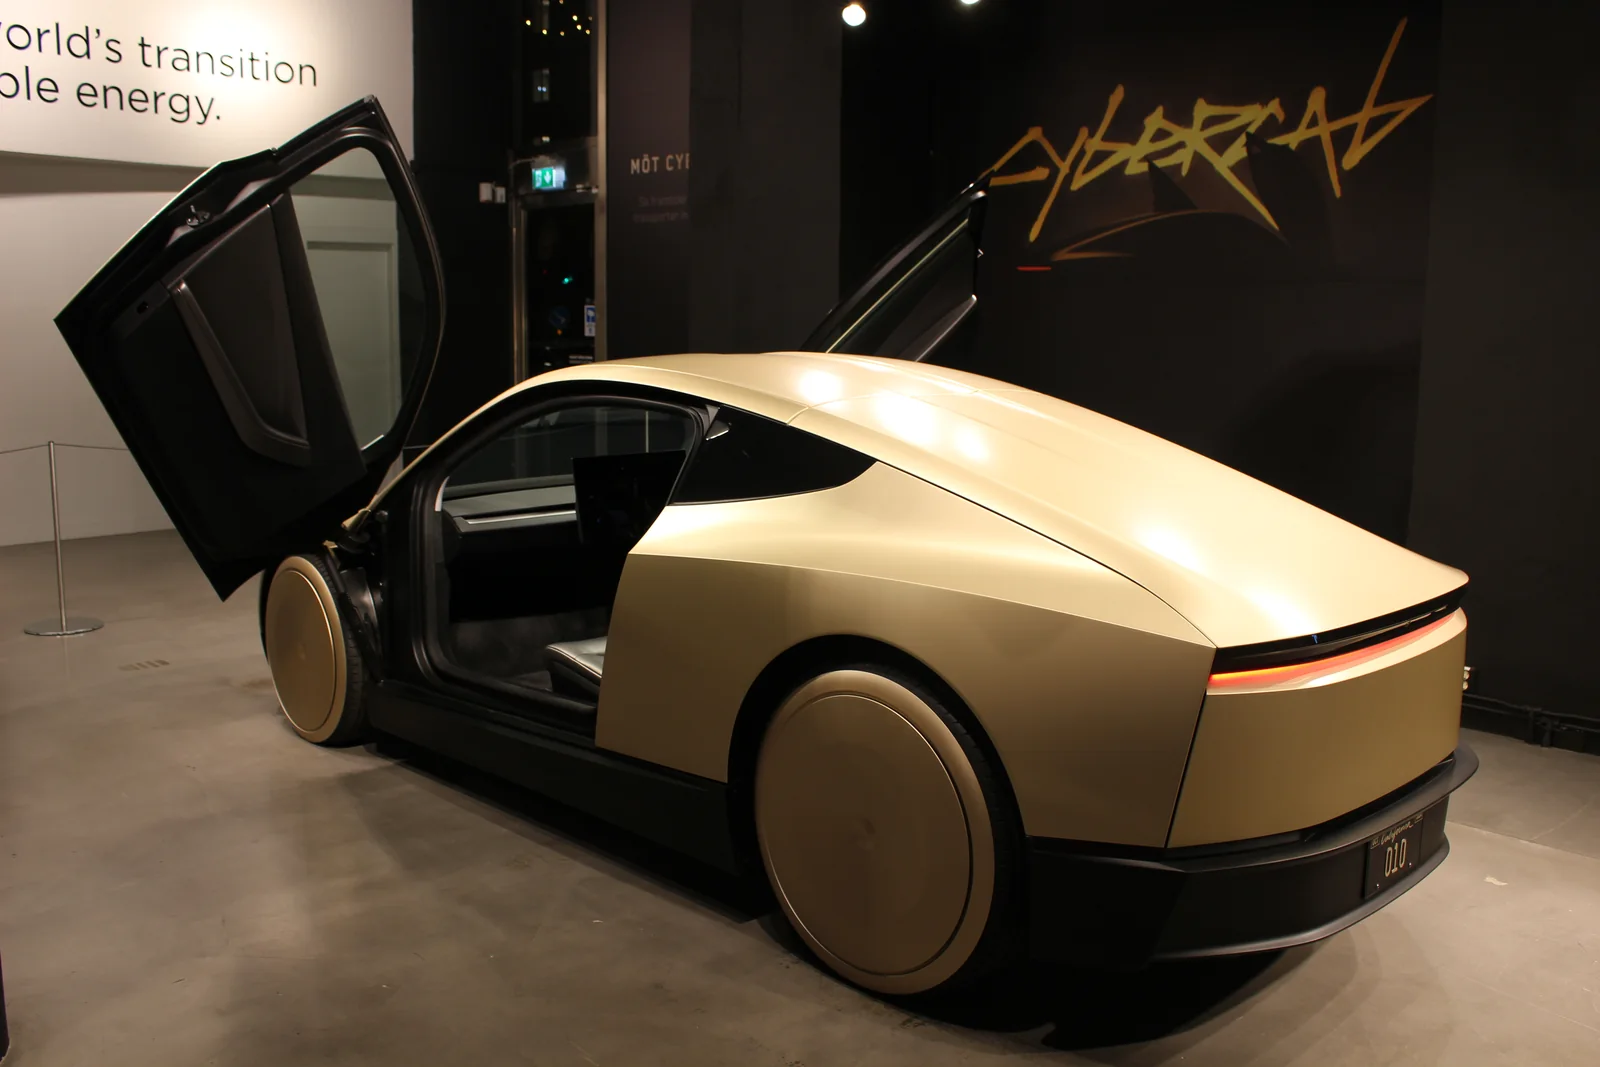
Price would not settle every household’s decision. Two people may need vehicles simultaneously, a rural pickup may involve a long wait, and an adapted vehicle or child seat may be essential. Cybercab has two seats: a family of four would need a larger vehicle or two cabs. Giving up the last car would require confidence across awkward journeys as well as easy ones. A low-mileage second car could therefore be an earlier candidate than the household’s only vehicle. [5]
Fewer owned cars could release money and parking space while the remaining vehicles work much harder. A private car may sit parked between trips; a shared car can repeatedly return for another passenger. Cheap rides can also replace a walk, a cycle trip or a transit journey, and make previously unaffordable trips possible. Those new journeys can bring valuable independence. They still consume street space, especially when the vehicle travels empty between bookings.
That distinction has appeared in research. A 2021 MIT-linked study of human-driven Uber and Lyft estimated increased congestion and lower transit use following their entry, without a statistically significant vehicle-ownership change. It was an observational study under very different prices and operating arrangements. It cannot predict the effect of a 30-cent autonomous service, but it gives reason to examine the trips being replaced rather than assume ride-hailing automatically removes cars. [6]
Replacing a busy bus exposes the physical constraint. In a deliberately simple example, 60 people each travel one mile. A bus assumed to carry all 60 makes one occupied vehicle journey; solo taxis require 60, and two-person taxis require 30. If a quarter of total robotaxi mileage is empty, the car fleets travel 80 or 40 vehicle-miles respectively. The bus’s own out-of-service mileage is excluded. Vehicle-miles are not a congestion or road-space ratio: buses are larger, and routes, junctions, stops and timing matter.
A transparent future-price scenario
Moving 60 people one mile
Illustrative US$0.30 fare; reference fares checked 30 October 2026
Assume one bus can carry all 60 people and each party follows the same one-mile route. These counts cover the occupied leg.
- 1BusOne bus assumed to carry all 60 people.
- 60Solo robotaxisOne passenger in each vehicle.
- 30Two-person robotaxisBoth seats occupied on the same trip.
| Moving 60 people one mile | Vehicles on the occupied leg | Robotaxi miles including empty travel |
|---|---|---|
| One bus carrying all 60 | 1 | Not modelled |
| One person per robotaxi | 60 | 80 |
| Two people per robotaxi | 30 | 40 |
With 25% of total robotaxi mileage empty, 60 occupied miles require 80 total miles; 30 require 40. This is not a 25% markup on occupied mileage.
Bus repositioning is excluded. Vehicle counts and vehicle-miles are not congestion or road-space ratios; vehicle size, junctions, stops, routing and timing differ.
Tesla: Cybercab Rider Guide: seats and seat belts · International Transport Forum / OECD: Urban Mobility System Upgrade
The International Transport Forum’s 2015 Lisbon simulation showed how fewer cars could coexist with more driving. A pooled-taxi scenario retaining high-capacity public transport raised daily car-kilometres by 6%; a sequential-ride scenario without that transit raised them by 89%. Those were different modelled systems, not forecasts for Tesla. Pooling and retained transit both changed, and the pooled vehicles had more seats than Cybercab. The result makes the network design worth examining before treating a smaller fleet as a congestion solution. [7]
Dense rail corridors present an even larger substitution problem. TfL gives an Elizabeth line train a nominal capacity of 1,500 people, including standing space. Replacing that full load with two-seat cars would require at least 750 occupied vehicles. That is capacity arithmetic, not a claim about typical train loads or a calculation of lane throughput. Quiet services and busy peak corridors cannot sensibly be treated as the same transport problem. [8]
A more useful combination could be a cheap ride to a frequent train, particularly where reaching the station currently requires a household car. Lightly used routes and inconvenient connections could face the strongest pressure to change. Replacing a crowded trunk service with individual cars risks transferring its passengers into the road bottleneck. Buses can also become electric or automated, and larger shared vehicles retain an occupancy advantage. The alternatives would keep developing alongside robotaxis.
Longer journeys would become interesting too. Under the assumption, 200 road miles cost $60 per vehicle, or $30 each for two people sharing. Whether that beats rail or a short flight depends on the actual tickets, route and party. Door-to-door convenience could favour a car when airport access and waiting dominate. Distance, charging stops, comfort and speed could favour another mode. LNER says its London–Edinburgh timetable offers journeys around four hours ten minutes: a low road fare still has to compete with that clock. [9]
The change could begin quickly for individual trips wherever reliable service becomes available. Giving up a second car would require a longer record of dependable peak-time pickups and acceptable fares, often tested against a renewal, lease ending or replacement purchase. A city-wide shift would also need enough vehicles, charging and operating capacity, suitable permissions and accessible services. Redesigning parking, streets and public transport would be another process again. None of those stages supplies a defensible universal launch year.
The important early signs would be ordinary ones: people cancelling a planned second-car purchase, using a station they could not conveniently reach before, or switching from a bus to an empty-seat taxi. Tracking those choices alongside occupied riders, empty mileage and congestion would show which transport system the low fare was building. A 30-cent ride could make travel easier and ownership less necessary. The outcome would depend on whether it strengthens useful shared connections or fills their place with more moving cars.
Sources
The links below support the statements attributed to them. A source’s own claims are identified in the article.
- We, Robot 2024: published Quartr transcriptQuartr transcript via Stock Analysis · Company projections in a published transcript; original audio not independently heard
- Subway and bus faresMetropolitan Transportation Authority · Official current fare and cap terms
- Bus and tram faresTransport for London · Official current and announced fare terms; dates distinguished
- New vehicle ownership costs hit $12,863 annuallyAAA–The Auto Club Group · Original 2026 ownership study announcement and method summary
- Cybercab Rider Guide: seats and seat beltsTesla · Manufacturer vehicle-capacity documentation
- Impacts of transportation network companies on urban mobilityNature Sustainability / MIT author repository · Original 2021 observational research; human-driven ride-hailing, not a robotaxi forecast
- Urban Mobility System UpgradeInternational Transport Forum / OECD · Original 2015 Lisbon simulation; assumptions and model status identified
- Elizabeth line post-opening evaluation: transport outcomesTransport for London / Department for Transport · Original 2024 capacity definition; nominal rather than typical load
- Customers benefit from LNER’s timetable changesLondon North Eastern Railway · Operator report, 25 February 2026; approximate timetable journey time